示例库
基本概念
示例:ManimCELogo

ref_classes: MathTex Circle Square Triangle
示例:大括号注释
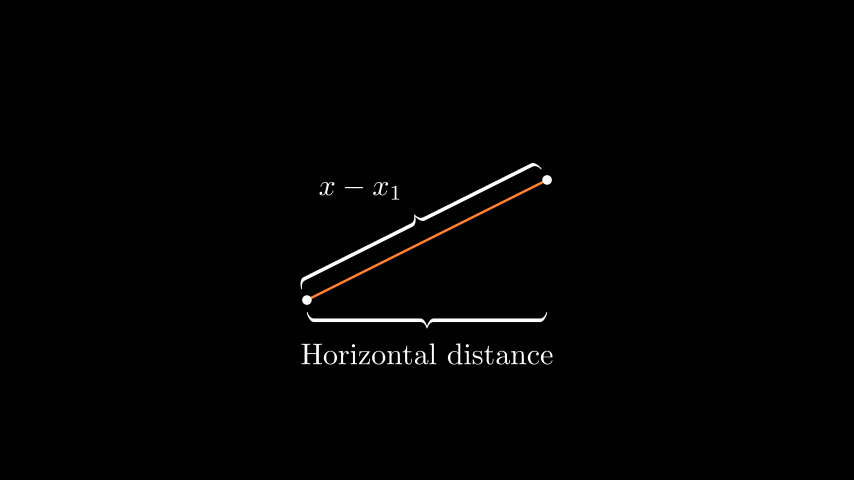
ref_classes:
Brace
ref_methods: Brace.get_text Brace.get_tex
示例:矢量箭头
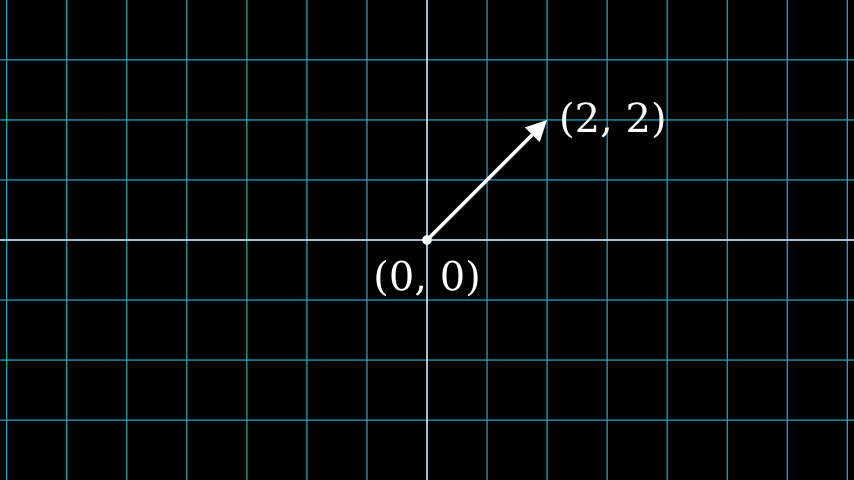
ref_classes: Dot Arrow NumberPlane Text
示例:来自数组的渐变图像
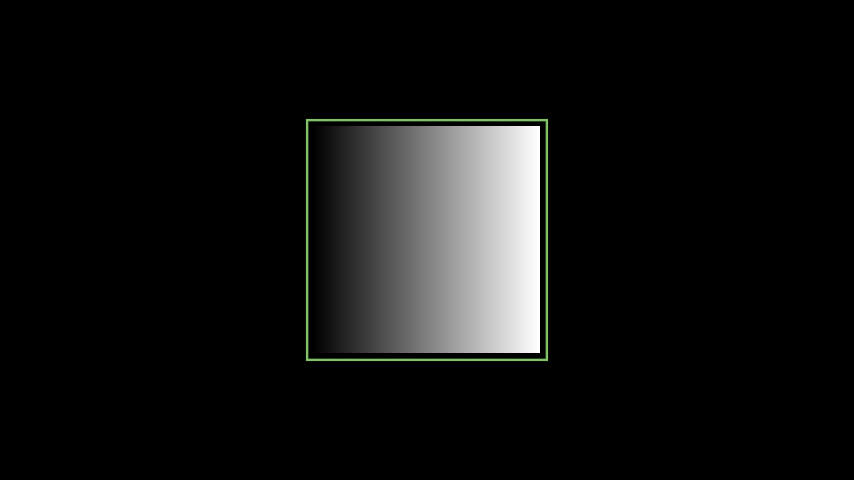
ref_classes: ImageMobject
示例:布尔运算
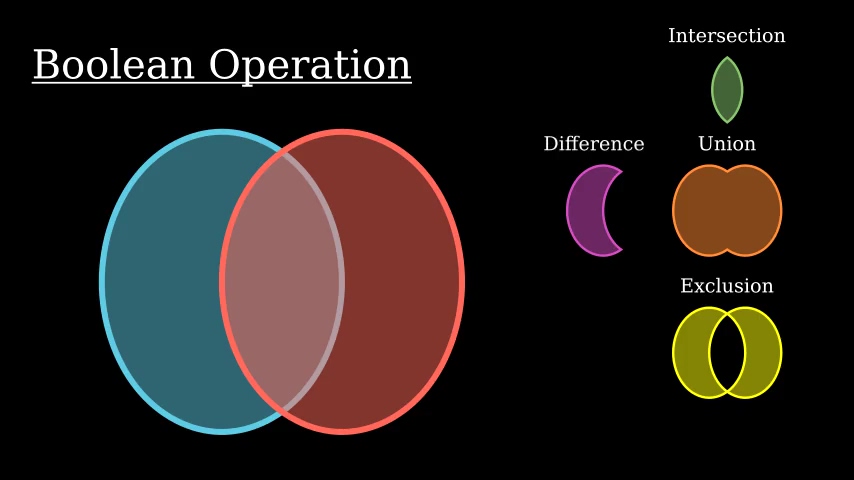
ref_classes:
Union Intersection Exclusion
动画
示例:图形上移动的点
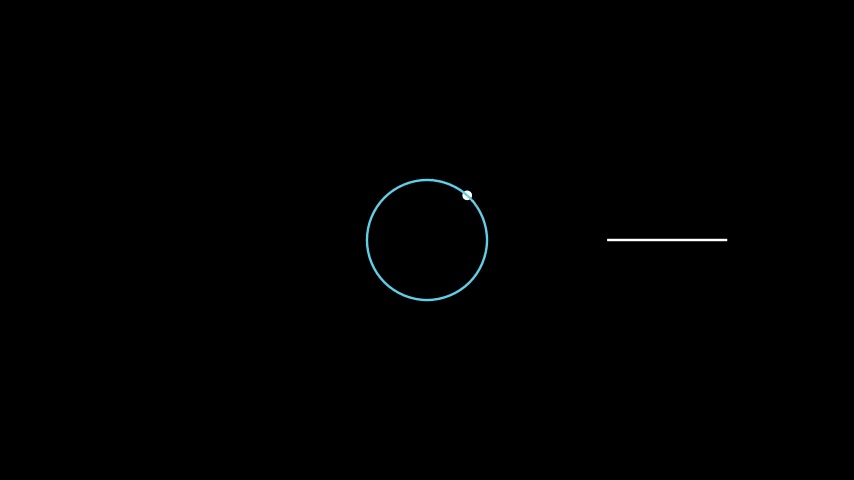
ref_classes:
Circle Dot Line GrowFromCenter Transform MoveAlongPath Rotating
示例:周围移动

| Python | |
|---|---|
Mobject.shift VMobject.set_fill Mobject.scale Mobject.rotate
示例:移动角度
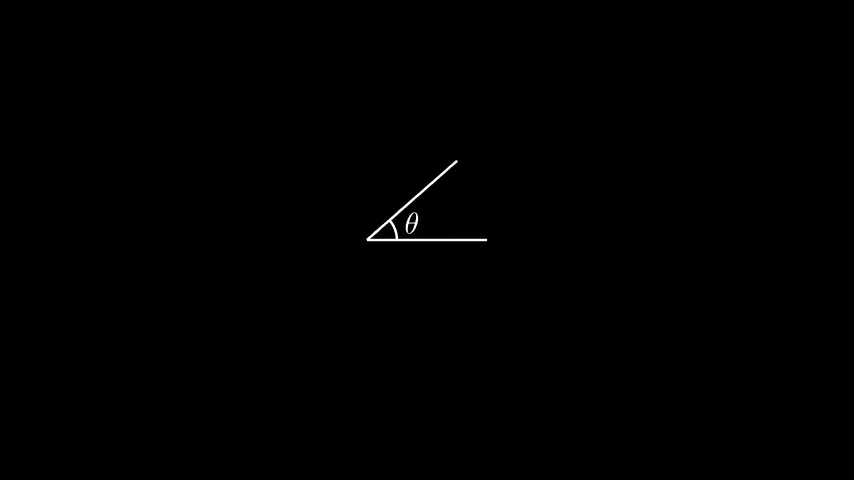
ref_classes:
Angle
ref_methods: Mobject.rotate
提示:你可以同时使用多个
ValueTracker。
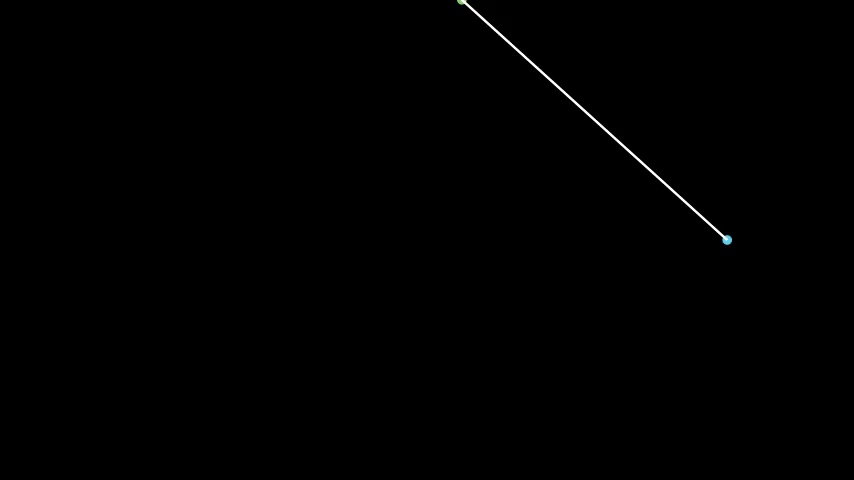
示例:移动点
示例:将组移至目的地

示例:移动框框
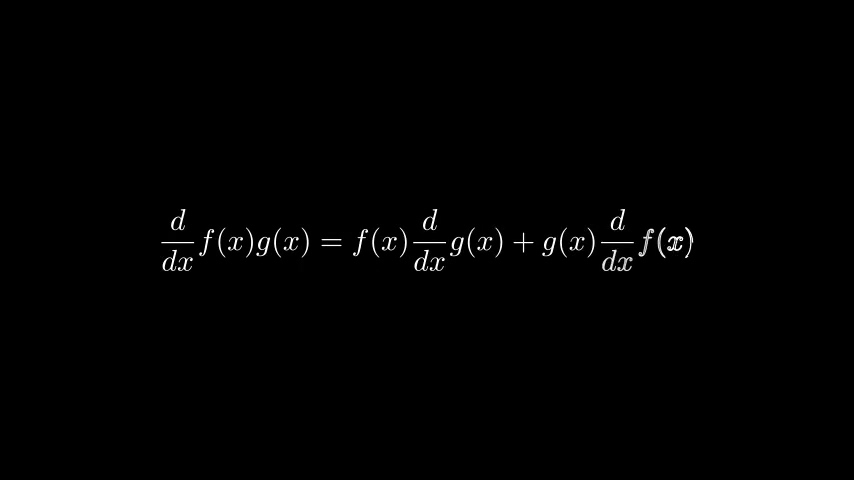
ref_modules:
manim.mobject.svg.tex_mobject
ref_classes: MathTex SurroundingRectangle
示例:旋转更新器
ref_methods:
Mobject.add_updater Mobject.remove_updater
示例:点与踪迹

ref_classes:
Rotating
ref_methods: VMobject.set_points_as_corners Mobject.add_updater
使用 Manim 绘图
示例:正余弦函数图
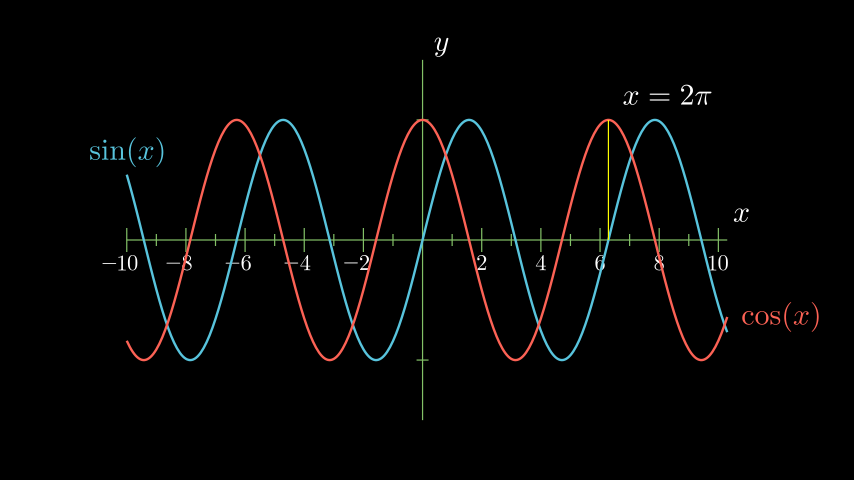
ref_modules:
manim.mobject.coordinate_systems
ref_classes: MathTex
ref_methods: Axes.plot Axes.get_vertical_line_to_graph Axes.input_to_graph_point Axes.get_axis_labels
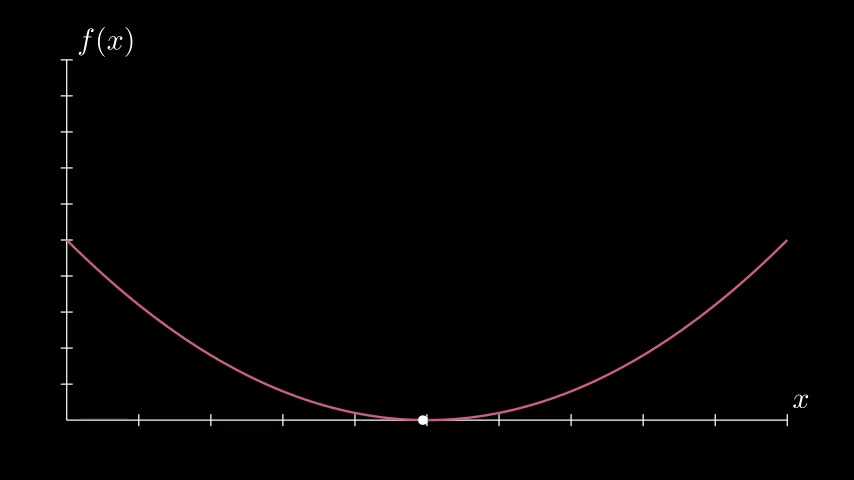
示例:参数最小值
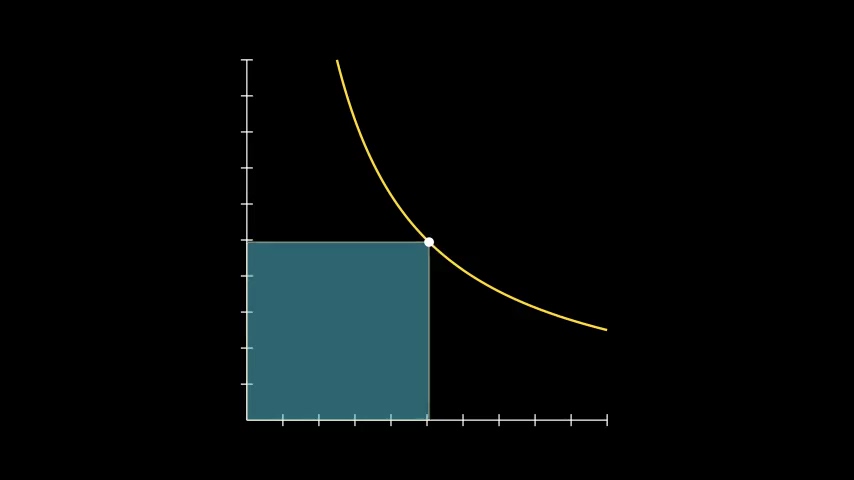
示例:图形面积图
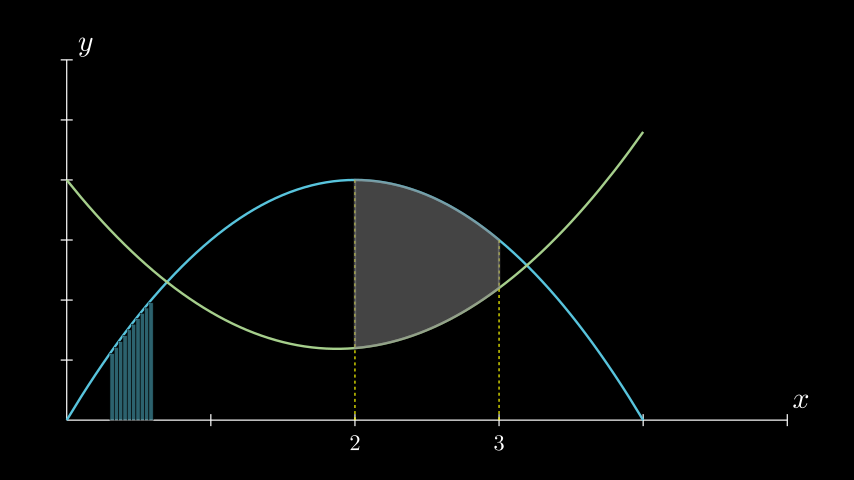
ref_modules:
manim.mobject.coordinate_systems
ref_methods: Axes.plot Axes.get_vertical_line_to_graph Axes.get_area Axes.get_axis_labels
示例:轴上的多边形
ref_classes:
Axes Polygon
示例:热力图
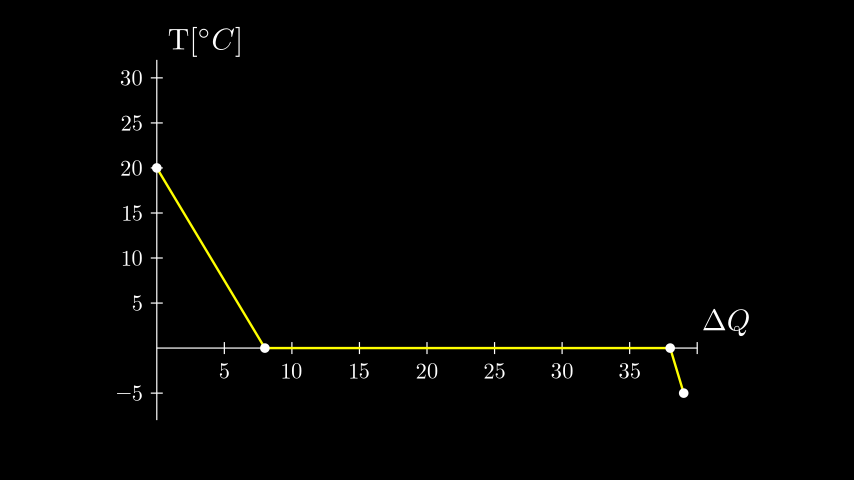
ref_modules:
manim.mobject.coordinate_systems
ref_methods: Axes.plot_line_graph Axes.get_axis_labels
特殊相机设置
示例:跟随图形相机
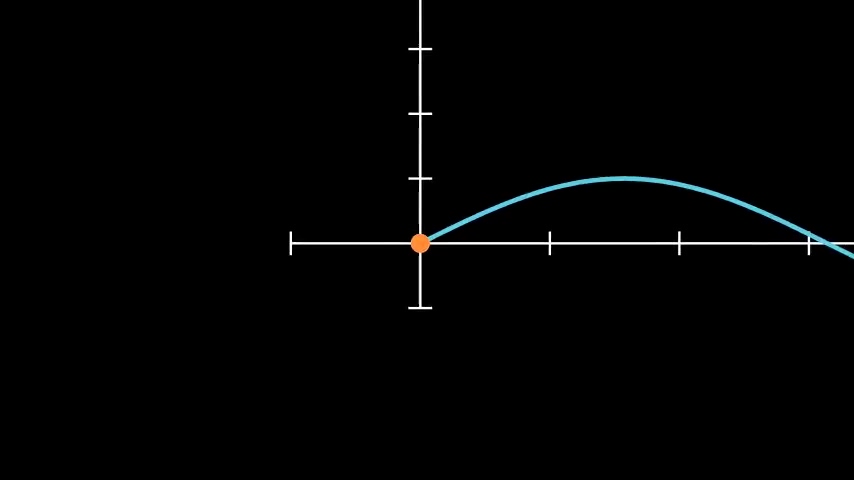
ref_modules:
manim.scene.moving_camera_scene
ref_classes: MovingCameraScene MoveAlongPath Restore
ref_methods: Axes.plot Mobject.add_updater
示例:移动缩放场景
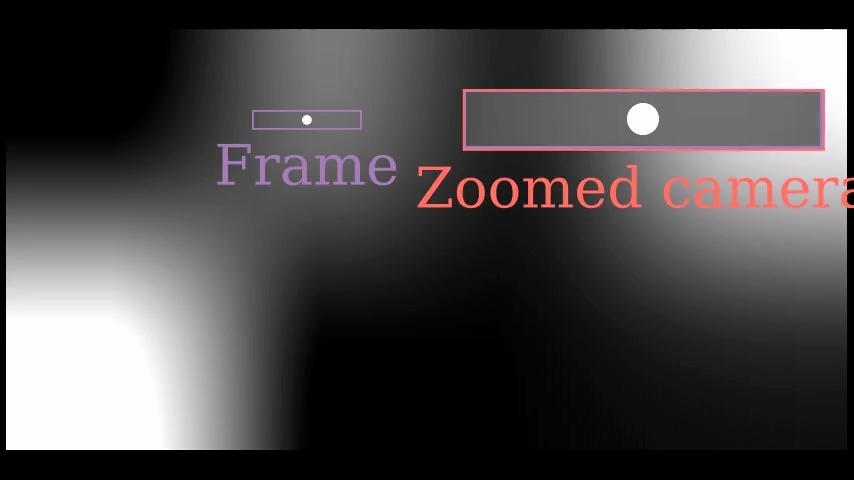
ref_modules:
manim.scene.zoomed_scene
ref_classes: ZoomedScene BackgroundRectangle UpdateFromFunc
ref_methods: Mobject.add_updater ZoomedScene.get_zoomed_display_pop_out_animation
示例:固定框架 MObject 测试
| Python | |
|---|---|
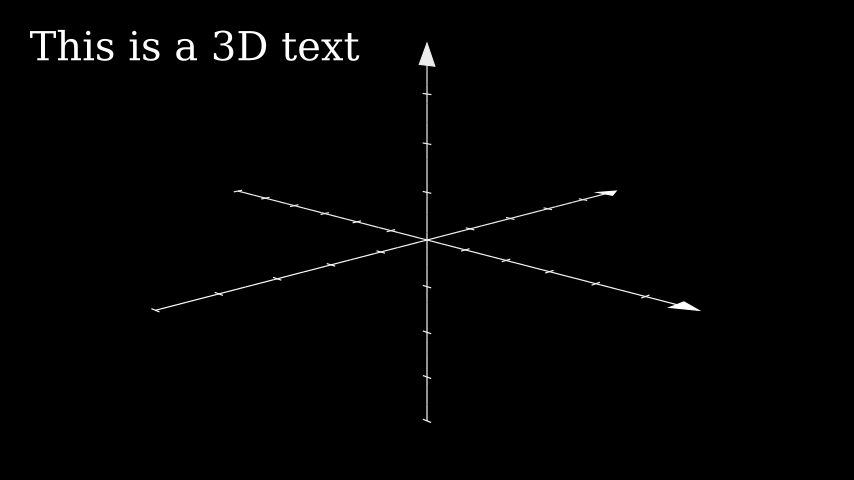
示例:三维光源位置
ref_classes:
ThreeDScene ThreeDAxes Surface
ref_methods: ThreeDScene.set_camera_orientation
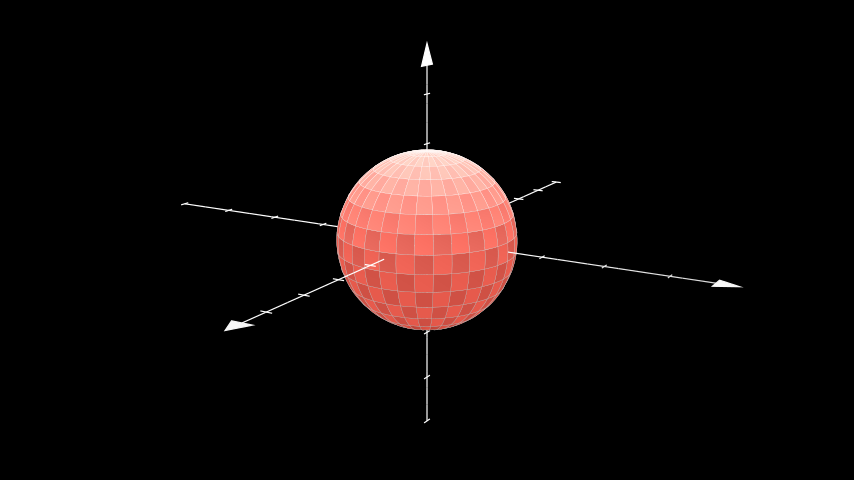
示例:三维相机旋转
ref_classes:
ThreeDScene ThreeDAxes
ref_methods: ThreeDScene.begin_ambient_camera_rotation ThreeDScene.stop_ambient_camera_rotation
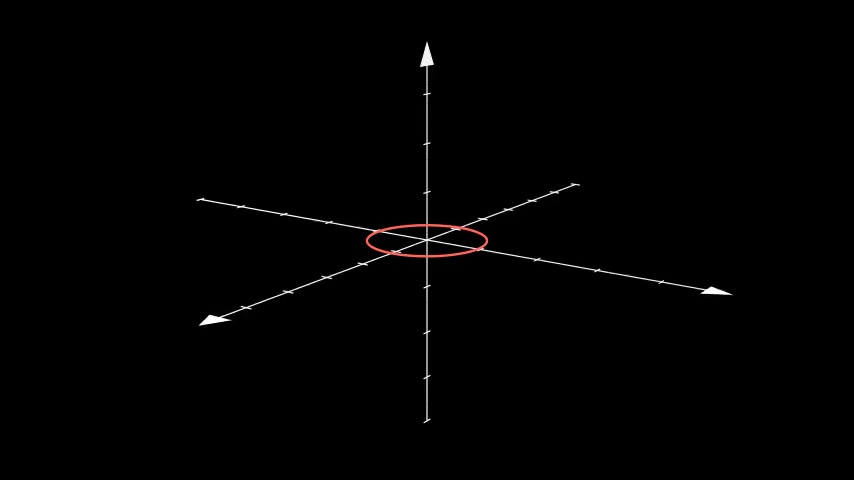
示例:三维相机错觉旋转
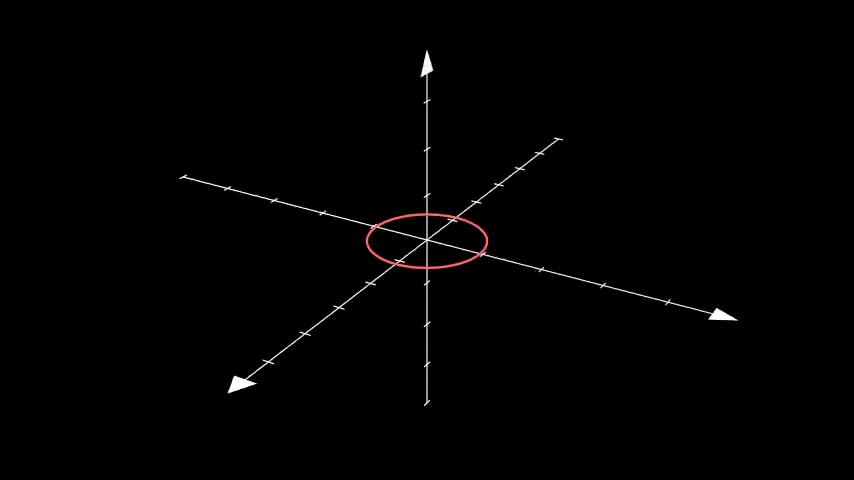
ref_classes:
ThreeDScene ThreeDAxes
ref_methods: ThreeDScene.begin_3dillusion_camera_rotation ThreeDScene.stop_3dillusion_camera_rotation
示例:三维曲面图
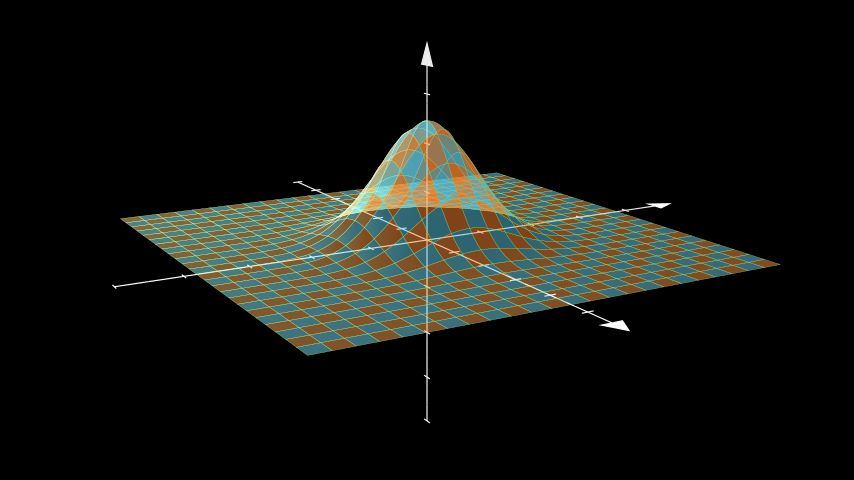
ref_classes:
ThreeDScene Surface
高级项目
示例:打开Manim
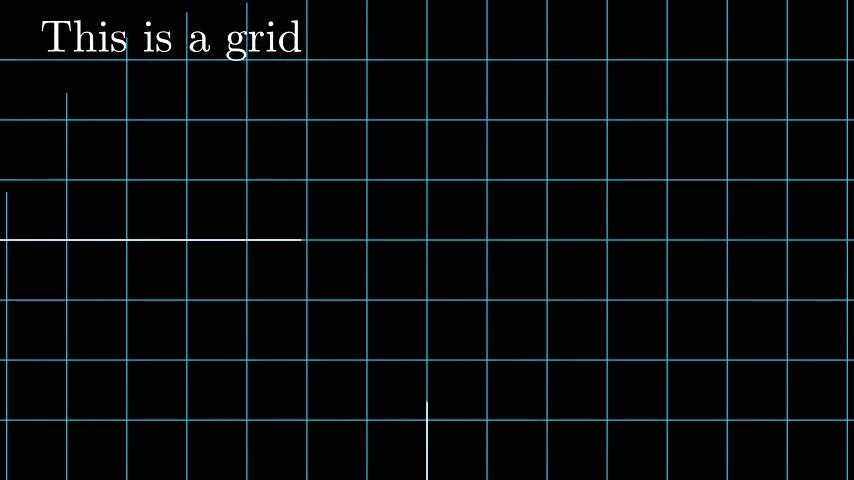
ref_classes:
Tex MathTex Write FadeIn LaggedStart NumberPlane Create
ref_methods: NumberPlane.prepare_for_nonlinear_transform
示例:正弦曲线单位圆
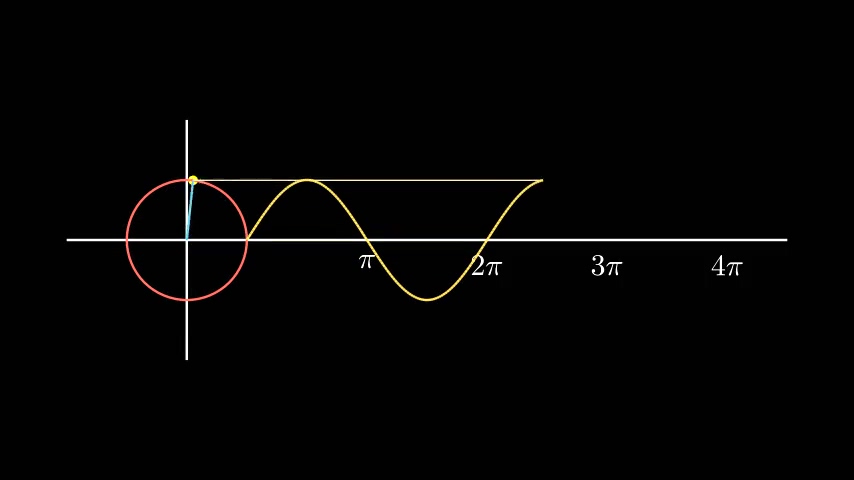
ref_classes: MathTex Circle Dot Line VGroup
ref_methods: Mobject.add_updater Mobject.remove_updater
ref_functions: always_redraw